
Projects
My portfolio illustrates how in recent years I have given structure to my research into the relationship between history and geography. It also shows that the emphasis in some research is related to the use of historical maps and in other instances to the creation of Geographical Information Systems (GIS). Frequently, however, it involves a combination of the two approaches.

'A landscape is the most solid appearance in which a history can declare itself.
It's is not background, nor is it stage ... There it is, the past in the present, constantly changing and renewing itself as the present rewrites the past.'
Inglis (1977)
Overview of projects
Method development and Landscape integrity assessment UNESCO World heritage NOMINATION 'Colonies of Benevolence' - Province Drenthe (2019)
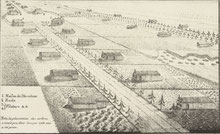
As part of the UNESCO World Heritage nomination of the Colonies of Benevolence of The Netherlands and Belgium it was essential to determine the landscape integrity of the colonies. With this goal in mind, I conducted research for the Dutch colonies of Frederiksoord-Wilhelminaoord, Veenhuizen and Wortel (Belgium) based on GIS data and fieldwork. I developed a method based on historical maps, architectural data and a highly detailed evaluation file. It was used to demarcate the boundaries of the site and its formal application.
Urbanisation of the Lowlands - TU Delft - Dutch heritage agency (2018-2019)
A system approach to urban development, water, energy and food in the landscape of the western part of the Low Countries - Led by Reinout Rutte and Jaap
Evert Abrahamse.
Work has been done on the development of environmental visions at various scales. Municipalities and provinces make their own visions and on an overarching scale the national environmental vision
will be initiated. It is customary to use historical research as a basis for spatial visions, such as zoning plans, structure plans, land use plans and regional plans.
In this project, a large amount of data will be generated and arranged. On the basis of these data analyses, maps and stories can be made that can serve as an example and inspiration for the
different areas. A number of example projects will be carried out during the course of the project. The basic data will be made available to all possible users in the so called Landscape
Atlas.
Based on historical and historical cartographic research, a GIS is created in which the urban systems of water management, flood protection, food and energy supply are mapped. These provide
insight into the historical long-term developments of such systems and can serve as a source of inspiration for contemporary issues concerning water issues, climate adaptation, food supply and
energy issues in and around our cities. This will be based on a system approach; two areas per theme are chosen as the subject for a case study. For the results, see the article 'Watersysteem en stadsvorm in Holland Een
verkenning in kaartbeelden: 1575, 1680, 1900 en 2015'.
Spatial impact of Green-Energy Transition - Jonge Honden

The policy that steers the Green-Energy Transition creates many spatial prognosis, plans and potentials. Instead of looking into the future, this project brought to light how spatial developments had taken place up to now (2018) in order to get an insight into patterns, tendencies and steering factors behind the start of renewable energy.
The spatial rail- and tramway legacy - Province Utrecht

For this project I researched the rail- and tramways in the Province of Utrecht. This resulted in a report that dealt with their construction, spatial consequences and heritage and a GIS. The GIS consisted of the (former) lines, the structures and scars they left in the landscape after abolishment and their specific function (people, goods, recreation). Apart from larger buildings such as stations, attention was paid to small details such as the façade anchors of the electric wires of tramlines. Lastly, it also included the immaterial heritage like street names that recall some long-lost railways.
Frisian Dike Atlas: NoordPeil

In this project I provided NoordPeil with a description of the landscape character and history of dikes: their function, year of construction, ‘current’ landscape condition and name. This information was used for an online GIS viewer. The departure point was the atlas Binnedijken en Slieperdiken yn Fryslan from Ir. K.A. Rienks and Ir. G.L. Walther (Bolsward, 1954).
Sandy Landscapes of North Western Europe – Dutch cultural heritage Agency


Sandy landscapes in the Netherlands have considerable cultural and historical importance. But since they are part of the Pleistocene sand which extends deep into Germany and Belgium, the question is to what extent the Dutch sandy landscapes are special in an international context. The object of this research thus was to make a universal typology and map of these landscapes that would be useful nationally as well as internationally. The classification was the result of a bottom up methodology.
Unrealised reclamation plans to drain the Zuider Zee - MPIWG

I carried out this inventory research for an associate of the Max Planck Institute of Science and Technology in Berlin. I subsequently analysed the first plan to drain the entire Zuider Zee and which was based on academic and technical considerations from 1848.
European Landscapes with a unique name - Wageningen university research (2014)

Europe is characterised by a great diversity of cultural landscapes. In this project I made a GIS which showed European landscapes with a unique name. The aim of this project was to come to a special classification which would enable landscapes to be clearly described and recognised by academics, policy makers, citizens and organiszations. In addition, using physical geographical data the characteristics of these defined landscapes was assessed. The 500 landscapes are the result of a top-down methodology. Publication.
Square meter prices of building plots in a 17th century urban expansion in Leiden - Scientific internship Dutch Heritage Agency

During my scientific internship at the Dutch Cultural Heritage Agency I analysed the relation between the square meter price of building plots and the urban design of the 1659 city extension of Leiden. The way this relation was previously established for the city of Amsterdam in the same century functioned as the central hypothesis. Which was confirmed: the price per square meter differed according to distance to the city centre, whether it was located at a street corner and depending on the type of infrastructure and the purpose of the plot. Interestingly also a planned (though never realised) large church had a had a price-raising effect.